Leaflet is a JavaScript library that allows you to create interactive maps in a very simple way. It is open source and mobile-friendly, which in Christian means that it gets along very well with mobiles.
Leaflet was created in 2011 by Volodymyr Agafonkin, a Ukrainian developer who is currently suffering from the war in his country and who warns us of it when we enter the website.
Leaflet is on https://leafletjs.com/, and contains a lot of documentation about its API, with multiple tutorials and a lot of plugins with which you can do a lot of very cool things. When you enter the website, and see the examples, it may seem that it is poor and that little can be done with this cartographic library, but when you see examples, you quickly realize that it is very powerful. For example, we can see some of them here.
- Civilian Harm in Ukraine (bellingcat.com)
- Ukraine Interactive map – Ukraine Latest news on live map – liveuamap.com
- Multiple examples of common things to do and others not so common (tomik23.github.io)
In short, you only have to look at the table of companies that appear on the homepage itself.
How does Leaflet work?
Getting started with creating a map in Leaflet is relatively straightforward. You just have to follow the starter tutorial that comes on the web, but since it implies that we know some things, here I am going to break it down a little better so that there is no doubt.
Let’s start by saying that we are going to create a map on a peeled and peeled html file, here we are not going to talk about WordPress or anything like that, we are going to go to the base to understand how it works, and then everyone can apply it where they want and as they know.
Well, as I said, we start from this simple html file:
<! DOCTYPE html>
<html lang="en-US">
<head>
	<meta charset="UTF-8">
	<meta http-equiv="X-UA-Compatible" content="IE=edge">
	<meta name="viewport" content="width=device-width, initial-scale=1.0">
	<title>What is Leaflet</title>
</head>
<body>

</body>
</html>
As you can see, it’s simple, the HTML5 doctype tag is defined, the tag that defines the language of the page, the head tags, where several parameters of the website are defined and, within which, we will have to make the call to Leaflet and, finally, the body tags, where we will show and build the map.
It’s that simple.
Call to the Leaflet bookstore.
It is possible to download the library to self-host it in the hosting itself, it would be recommended, for example, if we were creating a plugin for WordPress, so as not to make external calls. Although the JS bookcase is very light (barely 42 kb).
But we are going to follow the example set by its author. So we’re going to make the call to the website directly. To do this, what we will do is insert inside the head tags, just below the meta tags the call to the CSS file that accompanies Leaflet.
To do this, we will enter the following code:
<link rel="stylesheet" href="https://unpkg.com/leaflet@1.8.0/dist/leaflet.css"
   integrity="sha512-hoalWLoI8r4UszCkZ5kL8vayOGVae1oxXe/2A4AO6J9+580uKHDO3JdHb7NzwwzK5xr/Fs0W40kiNHxM9vyTtQ=="
   crossorigin=""/>
Next, and this is very important and warns us, the next line is the one that is responsible for loading the JavaScript library itself after having loaded the CSS styles file. If not, it won’t work.
Well, we are obedient and we do it.
 <script src="https://unpkg.com/leaflet@1.8.0/dist/leaflet.js"
   integrity="sha512-BB3hKbKWOc9Ez/TAwyWxNXeoV9c1v6FIeYiBieIWkpLjauysF18NzgR1MBNBXf8/KABdlkX68nAhlwcDFLGPCQ=="
   crossorigin=""></script>
In this way, we would already have our website ready to use Leaflet. But we are not going to be able to see anything on the web yet.
Be careful, it is important to warn, as can be seen in the code, that the files for a certain version of the library are being loaded. At the time of writing, this is version 1.8.0.
Painting the map
Well, let’s get to what you really want to see. Let’s paint a map once and for all. To do this, we go inside the body tags, which is where we have to include everything we want to show on the website (in case you don’t know HTML).
We will paint the map inside a div tag to which we will give the name of id map or whatever we want, but to avoid getting confused, we can call it map.
<div id="map"></div>
But this is still hardly anything, an invisible horizontal line on our map, so we must give it some measurements. We’re going to do this by applying CSS styles. To do this, we go back inside the head tags, and just before the title tag, we add some style tags.
Within them we will add the measurements of the map box, which in our example we are going to make 800px wide by 500px high. Therefore, the code will be as follows:
<style>
    #map {
        width: 800px;
        height: 500px;
    }
</style>
And you will say, but so far I still haven’t seen anything. Well, because you have to initialize the map, and tell it what you want to see. To do this, under the div tag where we are going to show the map, we will add some script tags, which is where we are actually going to give the instructions to “paint” our map.
The first thing is to start the map and tell it where in the world we want it to show us. I want the map to appear in Granada. To do this, I have to know the geographical coordinates of the place I want to show. I’m going to use cliché and show the Alhambra on my map. If I go to Google maps and right-click on it, I get a context menu where the first thing I see are the geographical coordinates of the monument. When you click on them, they are copied to the clipboard. These are: 37.17704280619901, -3.5915198660469008
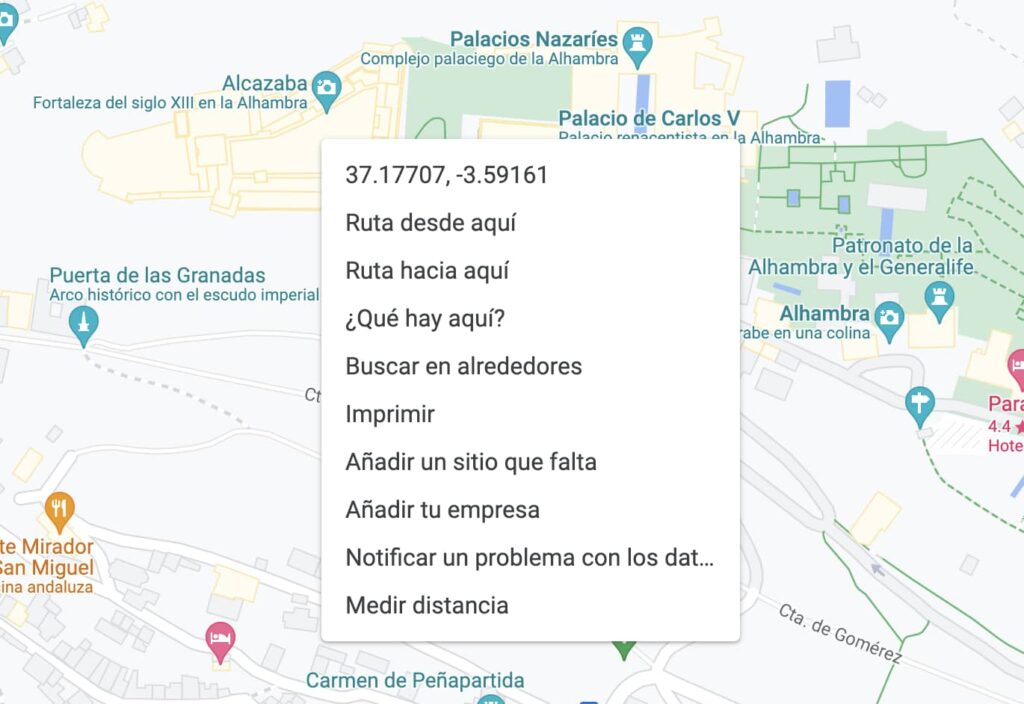
The first number is latitude, i.e. the horizontal lines that appear on maps, and the second number is longitude, i.e. the vertical lines that appear on the map. In the case of the former, being positive indicates that it is above the equator 37º and something, while the second indicates, being negative, that it is 3º East of the famous Greenwich meridian. The meridian 0.
The line that we are going to add inside the style tags is this:
var map = L.map('map').setView([37.17704280619901, -3.5915198660469008], 13);
What we have done is define the map variable and initialize the map with the object L (for Leaflet) (in the background you can hear the walrus clapping). This basically paints the canvas inside the div, and to tell it where we want to locate the center of the map (the point that is going to be in the center of the map), we use the setView method, which is where we add, in square brackets, the coordinates, and the degree of zoom we want to apply to the map.
The thing is that right now you may only be looking at a gray box. This is because we have not told you what cartographic basis we want to add. To do this, we will use the tilelayer method.

Here we are going to paste this code directly:
L.tileLayer('https://{s}.tile.openstreetmap.org/{z}/{x}/{y}.png', {
    maxZoom: 19,attribution
    : ' © OpenStreetMap'
}).addTo(map);
We are not going to go into too much detail, but basically the URL where it is located is specified (with certain parameters), the maximum zoom that is allowed and the attribution, which is the text that is seen in the corner of some maps.
The result is as follows:
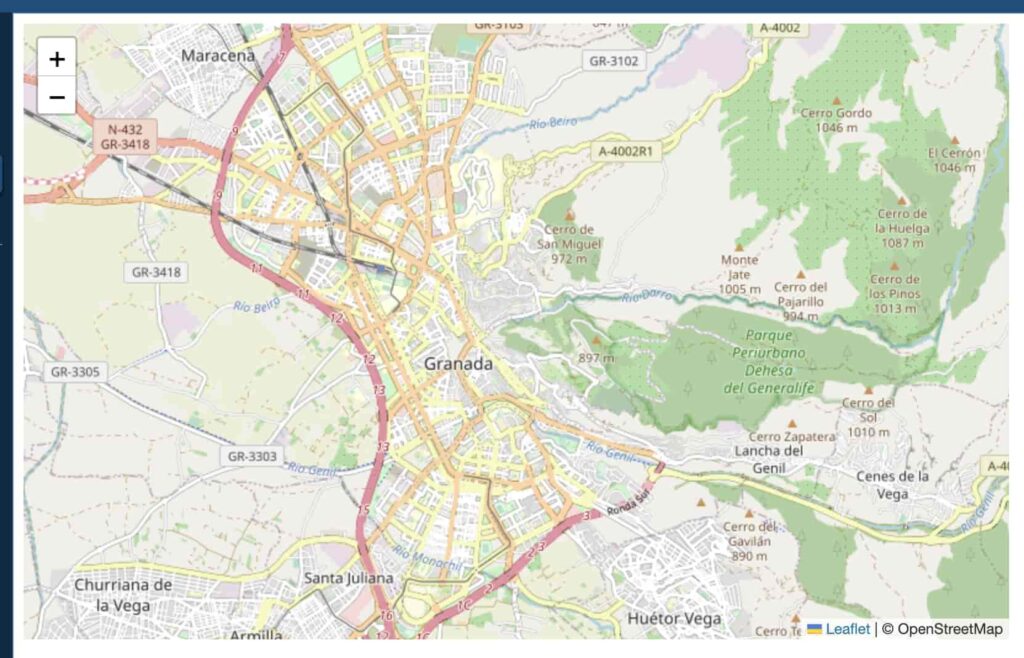
As we can see, we are very far from the Alhambra, it is barely distinguishable. We can change the zoom level on the line on which we set the map view.
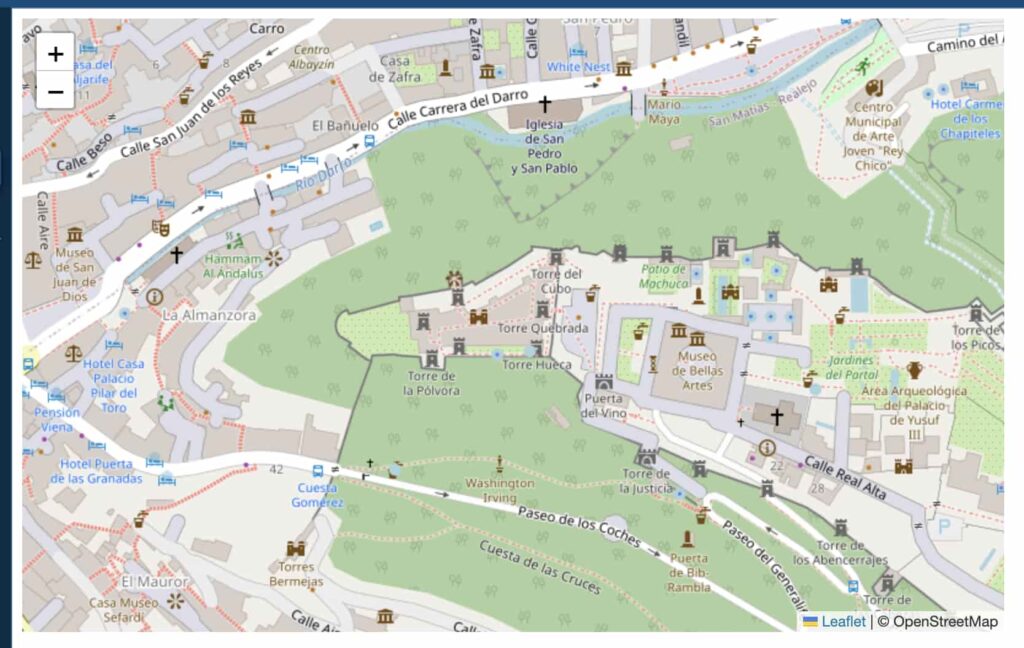
var map = L.map('map').setView([37.17704280619901, -3.5915198660469008], 17);
As you can see, things have changed a lot.
Well, we already have our map painted, and it hasn’t been that difficult either, if you look closely, the complete code has been as follows:
<! DOCTYPE html>
<html lang="en-US">
<head>
	<meta charset="UTF-8">
	<meta http-equiv="X-UA-Compatible" content="IE=edge">
	<meta name="viewport" content="width=device-width, initial-scale=1.0">
	<link rel="stylesheet" href="https://unpkg.com/leaflet@1.8.0/dist/leaflet.css"
	integrity="sha512-hoalWLoI8r4UszCkZ5kL8vayOGVae1oxXe/2A4AO6J9+580uKHDO3JdHb7NzwwzK5xr/Fs0W40kiNHxM9vyTtQ=="
	crossorigin=""/>
	<script src="https://unpkg.com/leaflet@1.8.0/dist/leaflet.js"
   integrity="sha512-BB3hKbKWOc9Ez/TAwyWxNXeoV9c1v6FIeYiBieIWkpLjauysF18NzgR1MBNBXf8/KABdlkX68nAhlwcDFLGPCQ=="
   crossorigin=""></script>
   <style>
		#map {
			width: 800px;
			height: 500px;
		}
   </style>
	<title>What is Leaflet</title>
</head>
<body>
	<div id="map"></div>
	<script>
		var map = L.map('map').setView([37.17704280619901, -3.5915198660469008], 17);
		L.tileLayer('https://{s}.tile.openstreetmap.org/{z}/{x}/{y}.png', {
			maxZoom: 19,attribution
			: ' © OpenStreetMap'
		}).addTo(map);
	</script>
</body>
</html>
If you notice, at the end of the tileLayer method the addTo command is executed, which tells it to add that layer to the map object we created by declaring the variable of the same name.
Can we do this in a slightly more elegant way?
Yes, I had to explain it to you, but I don’t like the spaghetti code. So let’s give it a little bit of a twist and we’re going to modularize things a little bit to make it a little more elegant. To do this, we’re going to pull the changes made using CSS to a style sheet that we’re going to call style.css and load it externally. The code will look like this:
<head>
	<meta charset="UTF-8">
	<meta http-equiv="X-UA-Compatible" content="IE=edge">
	<meta name="viewport" content="width=device-width, initial-scale=1.0"><
	link rel="stylesheet" href="https://unpkg.com/leaflet@1.8.0/dist/leaflet.css"
	integrity="sha512-hoalWLoI8r4UszCkZ5kL8vayOGVae1oxXe/2A4AO6J9+580uKHDO3JdHb7NzwwzK5xr/Fs0W40kiNHxM9vyTtQ=="
	crossorigin=""/>
	<script src=" https://unpkg.com/leaflet@1.8.0/dist/leaflet.js"
   integrity="sha512-BB3hKbKWOc9Ez/TAwyWxNXeoV9c1v6FIeYiBieIWkpLjauysF18NzgR1MBNBXf8/KABdlkX68nAhlwcDFLGPCQ=="
   crossorigin=""></script><
   link rel="stylesheet" href="style.css">
	<title>What is Leaflet</title>
</head>
On the other hand, we are going to extract all the JavaScript code with which we have shaped the map, and we place it in a .js file and link it from the index.html file as it should be, leaving the body as follows.
<body>
	<div id="map"></div>
	<script src="mapa.js"></script>
</body>
As you can see, the index.html is very clean. And the style.css and mapa.js files will look like this.
/* style.css */
#map {
	width: 800px;
	height: 500px;
}
mapa.js var map = L.map('map').setView([37.17704280619901, -3.5915198660469008], 17);
		L.tileLayer('https://{s}.tile.openstreetmap.org/{z}/{x}/{y}.png', {
			maxZoom: 19,attribution
			: ' © OpenStreetMap'
		}).addTo(map);
And what else can I do with Leaflet?
Obviously, Leaflet doesn’t stop at showing a map and that’s it. Its power lies precisely in the fact that we can add all kinds of markers (using the marker method, circles, polygons, small pop-up signs, etc. Also, since this is JavaScript, we can make these elements interact based on user-generated events.
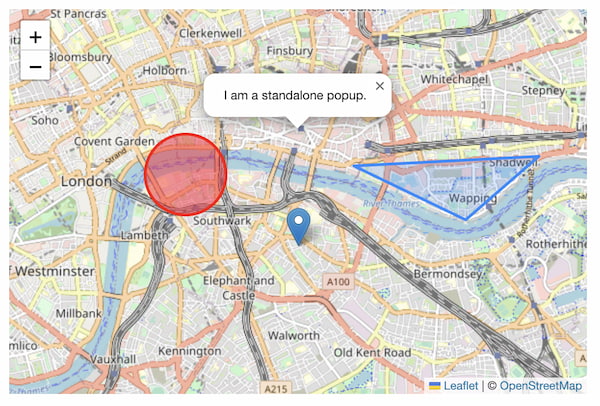
But, in addition, Leaflet has a lot of plugins that allow you to perform multiple actions such as searches, geometry editing, animations, heat mapping, geoprocessing (as in a GIS), etc.
As you can see, this is a very powerful tool that we will talk about at length in this blog, which I recommend you investigate.
Tell me, do you have experience with Leaflet? Share with me projects you have done with this tool.