What a question. It is enough to fill an entire blog, with several hundred entries. But since my intention is to explain what a GIS is to users outside the world of Geographic Information Systems, I will try to be as concise as possible.
What does GIS or GIS mean?
The acronym GIS in English is the acronym for Geographic Information System, so in Spanish its inverted use is accepted: SIG, acronym that stands for Geographic Information Systems.
From paper to GIS.
Maps have existed since the beginning of time, the first known maps were made in the Marshall Islands with sea shells on a lattice of palms. Representations of the terrain have been found in cave paintings, and it is assumed that the Egyptians must have mapped on papyrus, although there are no records.
It was not until a little more than half a century B.C. that the first cartography of the known world appeared, made by Anaximander of Miletus.
From then until today, we’ve seen everything from maps with sea monsters in the oceans to the upside-down, elongated or warped world. This is what are called projections. Someday we will talk about it.
The birth of GIS
In the 1960s, English geographer Roger Tomlinson planned and directed the development of the Canadian Geographic Information System, which is considered the world’s first computerized GIS.
But what does a GIS consist of? It is, according to Wikipedia, a “set of tools that integrates and relates various components that allow the organization, storage, manipulation, analysis and modeling of large amounts of data from the real world that are linked to a spatial reference, facilitating the incorporation of socio-cultural, economic and environmental aspects, which lead to decision-making in an effective way”.
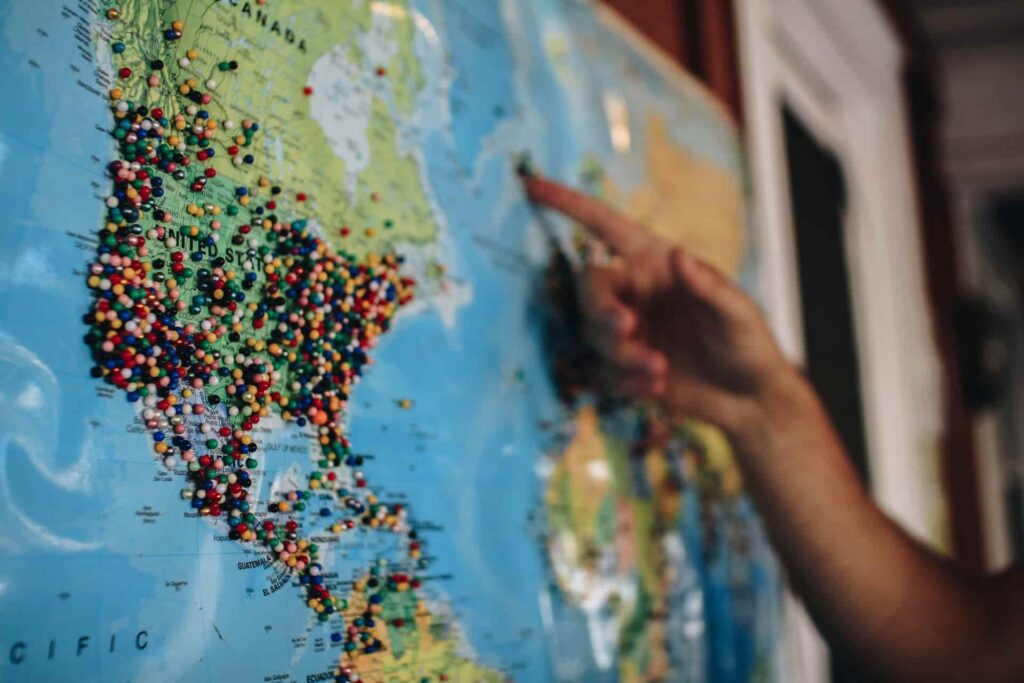
This, explained in a way that is understandable, is a map whose elements are associated with data. Do you remember those maps from killer movies with colored thumbtacks, with photographs or data pinned on the map? That could very well be a GIS.
What happens is that this type of use is very limited. But it was computers that made it possible to give true meaning to the concept.
On a computer, a GIS consists of a map with an associated database in which each element (whether a point, a line, a polygon or a pixel of an image) corresponds to a piece of data in that database.
Probably the most widely used GIS today is Google maps. Until the appearance of the first maps websites such as Google Maps, people were not very used to using maps, especially the GPS of the car, but they almost always used paper maps such as the Campsa Guide. And they didn’t get lost sometimes.
Nowadays anyone prepares their vacation with Google Maps.
Desktop GIS
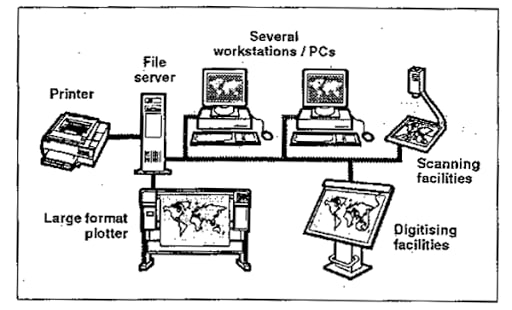
The first era of GIS started with desktop GIS, at first it was more hardware than software. Programs such as ArcInfo began, which required large digitizer tablets, powerful computers and huge plotters to be able to print the maps.
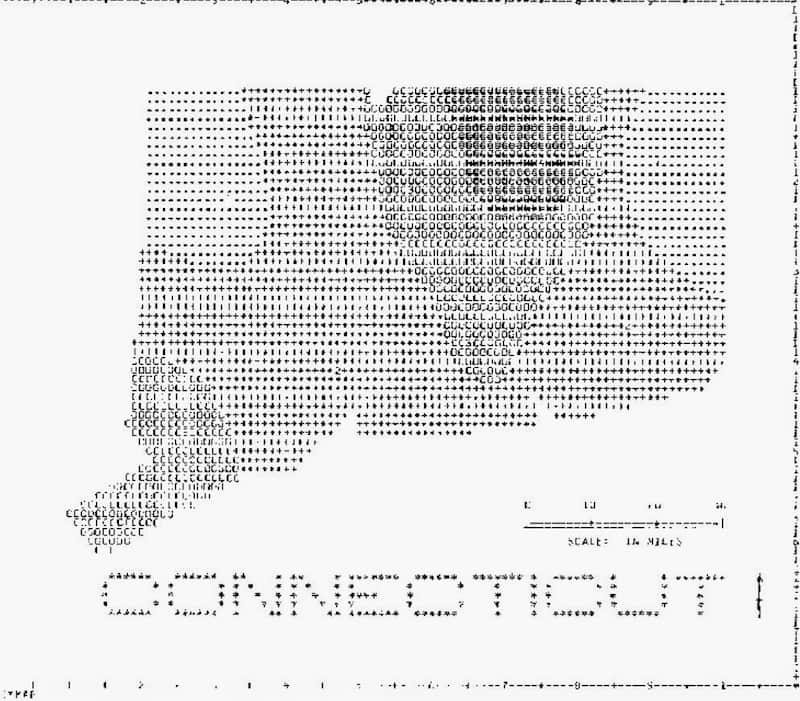
ArcInfo, created by the American company ESRI, was a mainly console software where almost everything was done with a text interface, commands in terminal mode and with a poor graphical result on the screen. But with these tools, enormous steps were taken in the world of computer-aided cartography.
Then came more visual tools such as ArcView, which, as its name suggests, were more focused on visualizing maps in a simpler way.
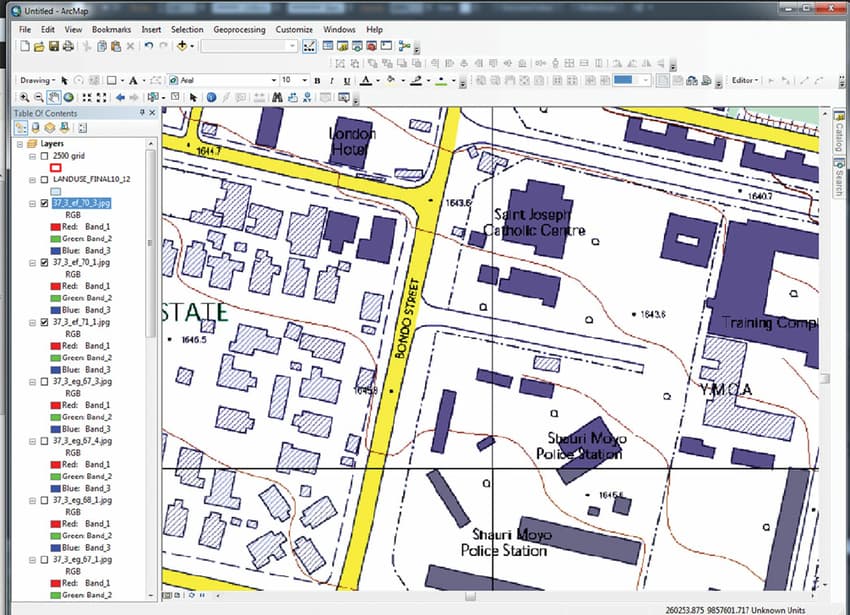
At the end of the 90s ArcGIS arrived, which became the standard. ArcGIS is probably the GIS equivalent of Microsoft Office in the world of office automation.
In fact, ESRI managed to convert its .shp files into standard format.
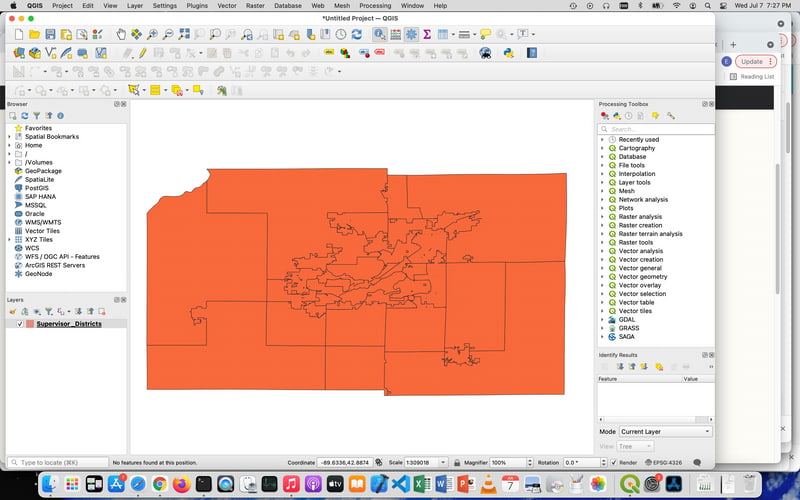
Of course, there have been and are other Geographic Information Systems. One of the best known, specialized more in raster analysis was Idrisi. There have also been those created by research centers or official organizations such as Ilwis and gvSIG, and there have been free software ones. Some of them were GRASS, SAGA GIS, Sextante, and all of them ended up being integrated into what is now the star desktop GIS along with ArcGIS, but in its free software version: QGIS.
QGIS we can say today that it is the WordPress of Geographic Information Systems, with a wide community behind it, and with a sponsorship system that has allowed it to advance unstoppably, and without having anything to envy to the great monster: ArcGIS.
Webmapping
As the Internet and the web have evolved, Geographic Information Systems have become more and more accessible for the browser. Initially, they were simple publications of data generated by desktop GIS to an interactive map in a web browser, as was the case with ArcGIS online, the version of ArcGIS for publishing maps in web format.
But tools such as Carto or Mapbox gave a boost to this type of maps, creating absolutely spectacular map productions.
There are also free software options such as Leaflet, a javascript library for map creation that is behind many WordPress map plugins, and that allows you to avoid the use of APIs.
We are living in a very interesting time in the constant appearance of cartographic tools for both web and mobile, in which it is advisable not to get lost, but which it is worth knowing.
GIS and WordPress
If we focus on the WordPress world, we will mostly find plugins for the insertion of Google Maps maps within the publications created in this famous CMS. But if you look a little deeper, you’ll find real gems. Tools that allow you to do very interesting tasks, both to create interactive maps and to map interiors and to present data visualizations, since maps are still a part of visual analytics, very extensive, but in the end it is about presenting data with a cartographic character.
My interest is to investigate precisely this relationship between the world of web cartography and WordPress, although I will not limit myself only to WordPress, sometimes I will investigate other areas. I also do not want to limit myself to cartography, but I intend to investigate the visualization of data as well.
My encouragement is that this is my blog to explore everything around this world both at the user level, and at the developer level, and learn. In short, to learn.