¿Quién no ha insertado un mapa en su web o en la de un cliente alguna vez en la vida? En este artículo vamos a ver por qué es importante elegir el software libre como alternativa, a la hora de insertar mapas en WordPress.
Este artículo está inspirado en la charla que di en Marzo de 2023 en WordCamp Chiclana, la cual puedes ver a continuación:
Planteamiento del problema
Todos hemos añadido alguna vez un mapa en nuestras webs o en las de nuestros clientes. El típico mapa de ubicación de un negocio o el de “Dónde estamos”. Y siempre recurrimos a Google Maps para insertar dicho mapa.
¿Recuerdas esa época en la que se veían un montón de mapas con el aviso “For development purposes only” y el fondo medio oculto por un velo gris?
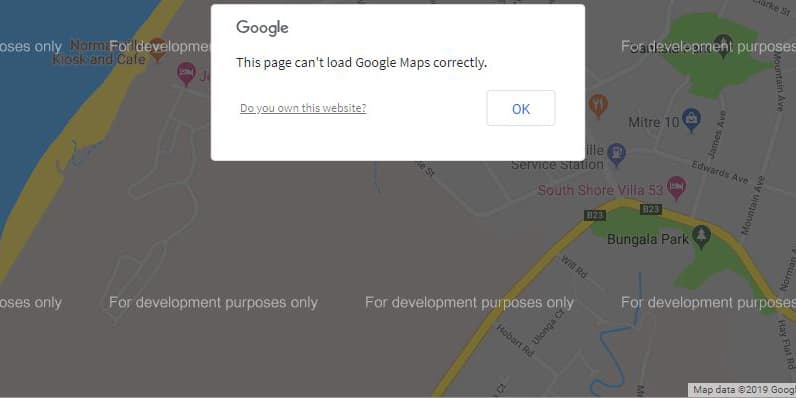
Esto se produjo por un repentino cambio de la API de Google Maps, en el que dejaba de ser tan “libre” su uso, y se hacía necesario darse de alta en dicha API y, sobre todo, introducir nuestra tarjeta, en caso de que un día tuviésemos el suficiente tráfico como para empezar a pagar por un módico precio el uso de la famosa plataforma de mapas. No obstante, en este blog explicábamos un pequeño truco para insertar un mapa sin hacer uso de la API de Google Maps.
Sin embargo, yo tenía claro que Google tenía que hacer mella en el rendimiento de nuestra web, dada su afición a aprovechar todos y cada uno de sus servicios para obtener información de cada clic del usuario.
Esto implica varios problemas:
- Si este mapa hace demasiadas peticiones externas o conexiones, nuestra web puede llegar a mostrar un bajo rendimiento, con las consecuencias que eso puede tener para el SEO.
- Por otro lado, a través de dicho mapa se puede rastrear el comportamiento del usuario en la web. Esto, especialmente en Europa, supone un problema de privacidad. Tampoco queda bien que el mapa no funcione si el usuario no acepta las cookies requeridas para su buen funcionamiento.
Opciones para insertar un mapa en una web
Así, a priori, podríamos plantearnos varias soluciones:
- Podemos no añadir el mapa a la web: Tampoco creo que debamos llegar a estos extremos. Es cierto que acabamos con todos los problemas posibles, salvo uno, ¿Cómo encuentra el usuario nuestro negocio?
- Podemos insertar un mapa de Google en un iframe. Esta es la solución que queremos evitar, y la que plantea estos problemas. Sigamos buscando.
- Podemos
hacer una captura de la imagen del mapa. Como puedes ver, me parece una solución cutre y no me gusta nada. Además, plantea ciertos problemas de accesibilidad. Por eso la he tachado. - Podemos utilizar un plugin de mapas. Esto ya me parece más civilizado. ¿Cuál podría ser este plugin? Veamos unos ejemplos.
- Map Block for Google Maps: Es un plugin bastante interesante para un mapa de Google. Facilita la conexión con la API y funciona con bloques, lo cual facilita también su uso en la web.
- WP Open Street Map: Es un plugin interesante, ya que utiliza una base cartográfica diferente a la de Google, en este caso Open Street Map. Es de código abierto.
- Leaflet Map: Se trata de otra tecnología de código abierto basada en una librería Javascript para cartografía.
- Mapster WP Maps: Aquí estamos hablando de palabras mayores. Se trata de un plugin comercial muy interesante, que hace uso de Mapbox, una librería Javascript para cartografía que tiene una gran potencia.
¿Por qué un mapa puede hacer que una web vaya lenta?
Veamos a continuación lo que se denomina una gráfica de cascada. En este caso, la hemos creado con la herramienta de análisis de rendimiento WebPageTest, que nos permite hacer un test de velocidad y rendimiento de cualquier web:
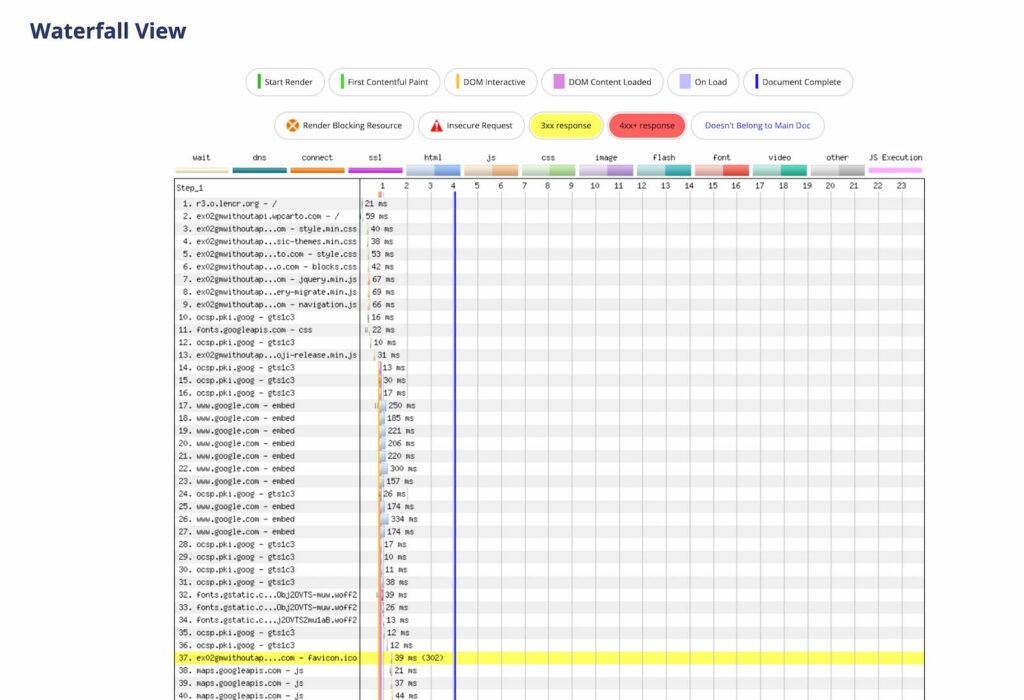
Como puedes ver, en esta gráfica se muestran todas las peticiones que realiza una web desde que introducimos el nombre del dominio, o hacemos clic desde un resultado de búsqueda en Google, hasta que se carga por completo la página.
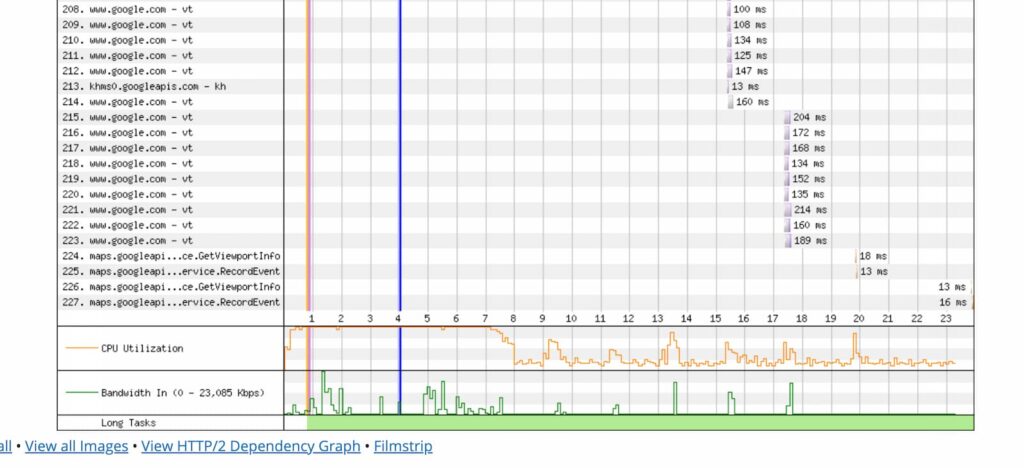
Si te fijas bien en ella, desde la petición 17 hasta la última, que es la 227, aparece la palabra Google. Por tanto, se están produciendo más de 200 peticiones a Google a lo largo de 23 segundos de carga. Es cierto que puedes interactuar con la web antes de que finalicen esos 23 segundos, pero yo ya me habría ido.

## Salgamos de dudas con un experimento
A partir de ver esto, decidí hacer un experimento. Para ello creé 6 webs con WordPress idénticas. Estas webs contaban con las mismas características:
- Un tema clásico (Twenty Twelve)
- 10 entradas que se mostraban completas en la página de inicio. Sí, hay webs que pueden necesitar mostrar varios mapas en una misma página, y por eso quería ver el efecto acumulado que podían producir en el rendimiento de la misma.
- A todas las webs, salvo a una que utilicé de control, le inserté 10 mapas, uno en cada entrada, con ubicaciones diferentes para que no se cachearan.
- A cada una de las webs le hice 5 tests de velocidad con WebPageTest con objeto de obtener una muestra representativa y una medida promedio. Este promedio lo calculé con la mediana y no con la media, con objeto de eliminar el efecto de sesgo de algunas medidas anómalas.
De los tests extraje los siguientes parámetros, que consideré los más importantes para dar una respuesta a mis dudas:
- FCP (First Contentful Paint): Se trata del tiempo que transcurre hasta que se pinta el primer pixel que se pinta en pantalla desde que se llamó a la web.
- DC Time (Document Complete Time): Se trata del tiempo que transcurre hasta que se carga todo aquello que es necesario para que podamos interactuar con los elementos de la web mientras se siguen cargando cosas.
- Time: Es el tiempo total de carga de la web. Cuando la ruedecita del navegador se para, indicando que ya no queda más por cargar.
- Requests: Son todas las peticiones externas que se realizan desde la web para poder mostrar todo el contenido.
- Total bytes: Se trata del peso de los archivos descargados en nuestro navegador para mostrar la web completa en kbytes.
Todo esto lo aglutiné en una hoja de cálculo, calculé los promedios para cada uno de los parámetros elegidos (por favor no te vayas, estos son los únicos números que vas a ver).

Resultados del experimento
Si nos fijamos en los resultados obtenidos para los dos primeros parámetros, el First Contentful Paint y el DC Time, vemos que no hay diferencias significativas.
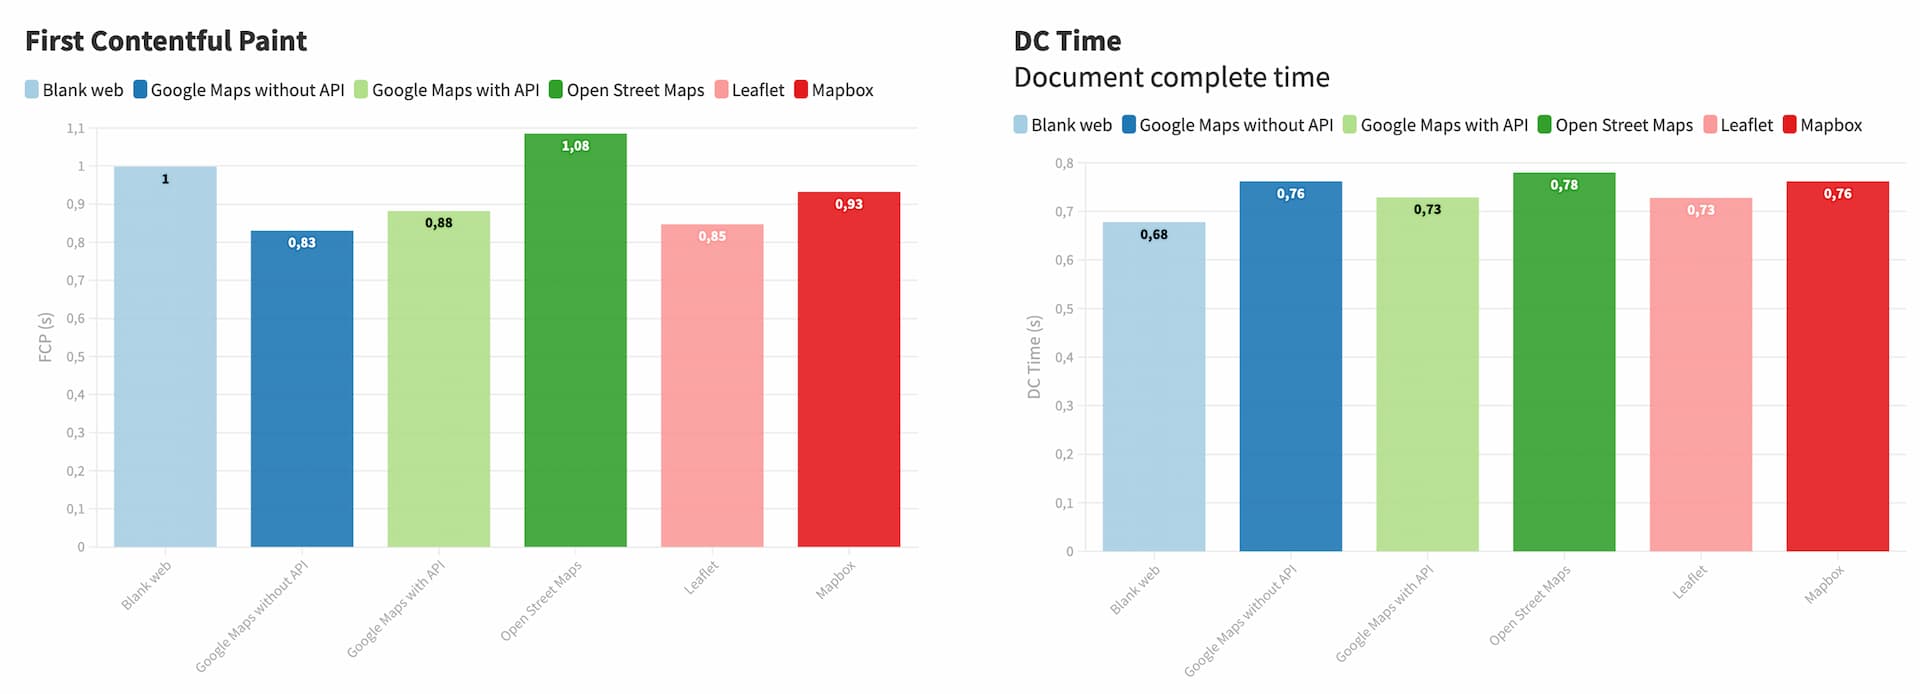
Hay que tener en cuenta siempre que, en estas y en las siguientes gráficas, la primera columna corresponde a la web de control, la segunda a la web en la que añadí los mapas de Google con un iFrame (sin API), la tercera se trata de una web en la que se añaden los mapas de Google Maps con un plugin y haciendo uso de la API. De las siguientes, la cuarta, corresponde al uso de un plugin que inserta los mapas haciendo uso de Open Street Map, la quinta se trata de un plugin que trabaja con Leaflet y la última es el plugin que hace uso de Mapbox. Se trata por tanto de los plugins que planteé al principio del artículo.
Si te fijas, el primer pixel se pinta con diferencias de décimas de segundo, mientras que el momento en el que podemos interactuar es básicamente el mismo con muy poca diferencia. Habría que hacer una Photo-Finish.
Por tanto, esto no nos dice absolutamente nada. Pero ¿qué sucede con los demás parámetros? Veamos el resultado.
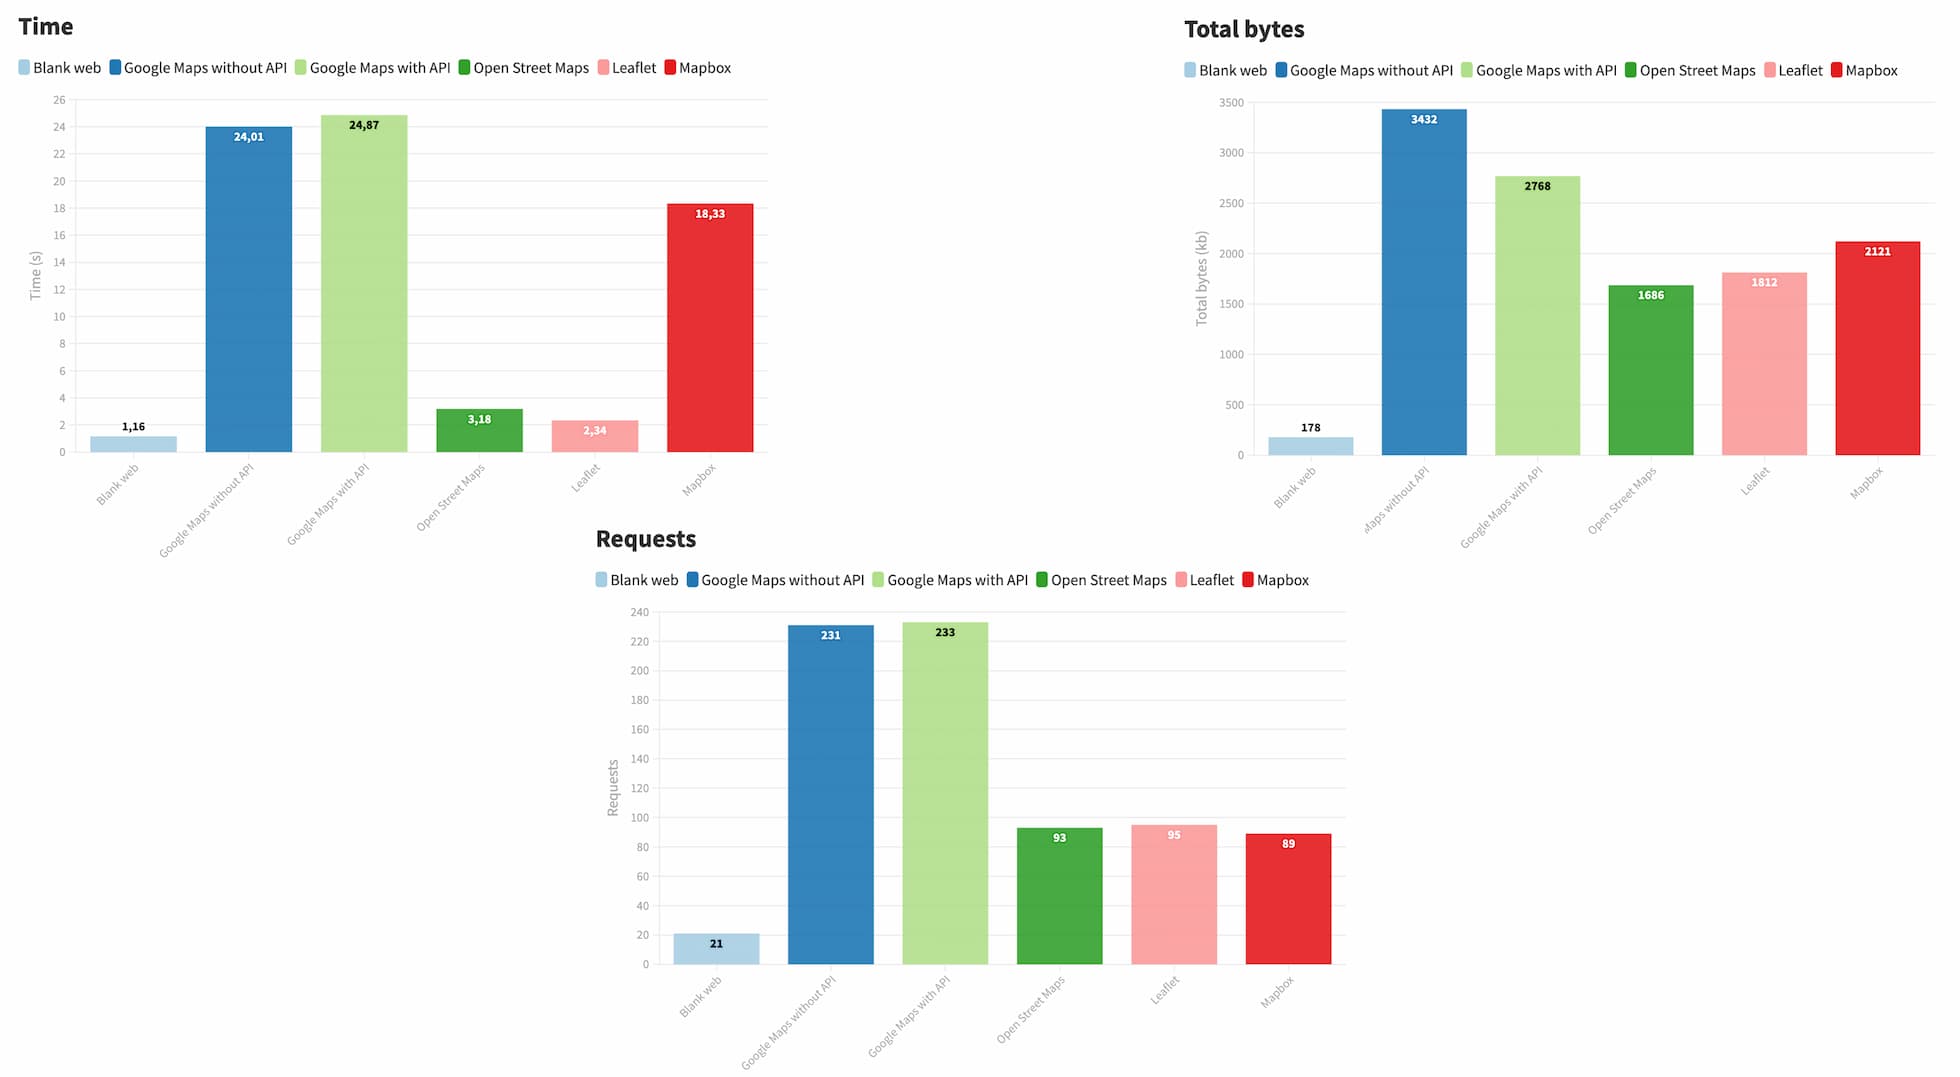
Bueno, ya se puede decir, las torres gemelas en todas las gráficas corresponden a Google.
Como puedes ver, la web de control ha hecho su función, y da los valores significativamente más bajos en el tiempo de carga total de la web, en la cantidad de datos descargados y en el número de peticiones, que son mínimas.
Sin embargo, vemos que tanto el tiempo de carga total como el número de peticiones son realmente escandalosos tanto en el caso de insertar un mapa con un iFrame como en el de hacerlo mediante un plugin y conectando con la API de Google.
Hay que destacar el tiempo tan escaso que tardan en cargar tanto Open Street Map como Leaflet, así como el bajo número de peticiones que realizan las tres opciones diferentes a Google.
Sin duda, la peor opción es la inserción de un iFrame. Y es que, lo de incrustar una web dentro de otra, está un poco pasado de moda, es una tecnología del pasado.
Mapbox sí que se toma un tiempo de carga total mayor, que se acerca a Google, y se entiende, ya que ofrece unas posibilidades gráficas que no son las de Google. De hecho, a Mapbox lo vamos a tratar un poco aparte, puesto que se trata de una librería Javascript, con un motor de renderización 3D, que nos permite hacer cosas brutales.
¿Qué solución escogería para insertar un mapa?
Creo que a la luz del resultado de estos experimentos, no hay dudas de que Leaflet, por las posibilidades que ofrece y por su rendimiento, parece ser la opción más idónea a la hora de insertar un mapa en una web.
De hecho, si eres desarrollador WordPress, te invito a que te adentres en Leaflet, y que te animes a crear nuevos plugins que utilicen esta librería. Si no sabes lo que es Leaflet, te invito a que lo conozcas en este artículo.
¿Cómo podemos insertar Leaflet en WordPress?
Podemos hacerlo gracias. avarios plugins:
- Map Block Leaflet: Es un plugin fantástico, y muy sencillo, del que te hablé en este blog. Para añadir mapas sencillos es genial.
- Leaflet Map: Se podría decir que es el plugin oficial de Leaflet. Es bastante completo, aunque arrastra un poco el atraso de funcionar todavía con shortcodes. No obstante, es una opción muy buena para mapas algo más complejos.
- Extensions for Leaflet Map: Se trata de un complemento al anterior plugin, y nos permite ya hacer cosas muy locas. Es algo experimental, pero no te lo puedes perder si quieres hacer mapas algo más vitaminados. Por ejemplo, con él podríamos montar mapas de rutas en bici a partir del archivo .gpx de nuestro GPS. Pero se pueden hacer muchas más cosas.
Conclusiones
Como hemos podido ver en este artículo, el software libre nos ofrece opciones muy potentes para introducir mapas en una web en WordPress, sin comprometer su rendimiento.
A tenor de los datos, Google Maps ofrece más bien poco y a un coste de rendimiento y privacidad bastante alto.
Por tanto, una opción bastante interesante puede ser Leaflet, en caso de que tengamos unas necesidades de uso básicas a intermedias. Y, si necesitamos ofrecer una mayor potencia, con mapas en 3D, que muestren ciertos efectos, etc, Mapbox siempre será una muy buena opción.
Cuéntame en los comentarios tu experiencia, y si conoces otros plugins para insertar mapas, que utilicen software libre.