Who hasn’t inserted a map on their website or a client’s website at some point in their life? In this article, we’re going to look at why it’s important to choose free software as an alternative when embedding maps in WordPress.
This article is inspired by the talk I gave in March 2023 at WordCamp Chiclana, which you can see below:
Problem statement
We’ve all added a map to our websites or our clients’ websites at some point. The typical business location map or the “Where We Are” map. And we always turn to Google Maps to insert such a map.
Do you remember that time when you could see a lot of maps with the sign “For development purposes only” and the background half hidden by a gray veil?
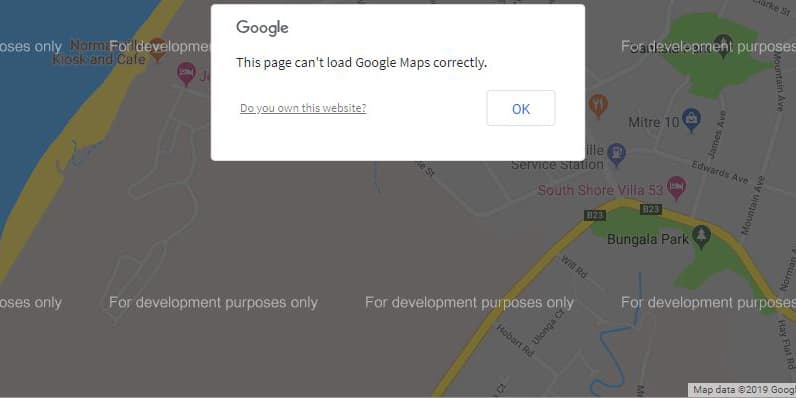
This was caused by a sudden change in the Google Maps API, in which it was no longer so “free” to use, and it was necessary to register in said API and, above all, enter our card, in case one day we had enough traffic to start paying for a small price to use the famous map platform. However, in this blog we explained a little trick to insert a map without making use of the Google Maps API.
However, it was clear to me that Google had to make a dent in the performance of our website, given its penchant for taking advantage of each and every one of its services to obtain information from every user click.
This involves several problems:
- If this map makes too many external requests or connections, our website may show poor performance, with the consequences that this can have for SEO.
- On the other hand, through this map, the user’s behavior on the web can be tracked. This, especially in Europe, is a privacy issue. It is also not good if the map does not work if the user does not accept the cookies required for its proper functioning.
Options for embedding a map on a website
Thus, a priori, we could consider several solutions:
- We can not add the map to the web: I don’t think we should go to these extremes either. It is true that we end up with all possible problems, except one, how does the user find our business?
- We can insert a Google map into an iframe. This is the solution we want to avoid, and the one that raises these problems. Let’s keep looking.
- We can
take a screenshot of the map image. As you can see, I think it’s a crappy solution and I don’t like it at all. In addition, it raises certain accessibility issues. That’s why I’ve crossed it out. - We can use a maps plugin. This already seems more civilized to me. What could this plugin be? Let’s look at some examples.
- Map Block for Google Maps: This is a pretty interesting plugin for a Google map. It makes it easy to connect to the API and works with blocks, which also makes it easy to use on the web.
- WP Open Street Map: It’s an interesting plugin, as it uses a different cartographic base than Google’s, in this case Open Street Map. It’s open source.
- Leaflet Map: This is another open-source technology based on a Javascript library for cartography.
- Mapster WP Maps: We’re talking about big words here. It’s a very interesting commercial plugin that makes use of Mapbox, a Javascript library for cartography that has great power.
Why can a map make a website go slow?
Let’s take a look at what’s called a waterfall chart. In this case, we have created it with the WebPageTest performance analysis tool, which allows us to test the speed and performance of any website:
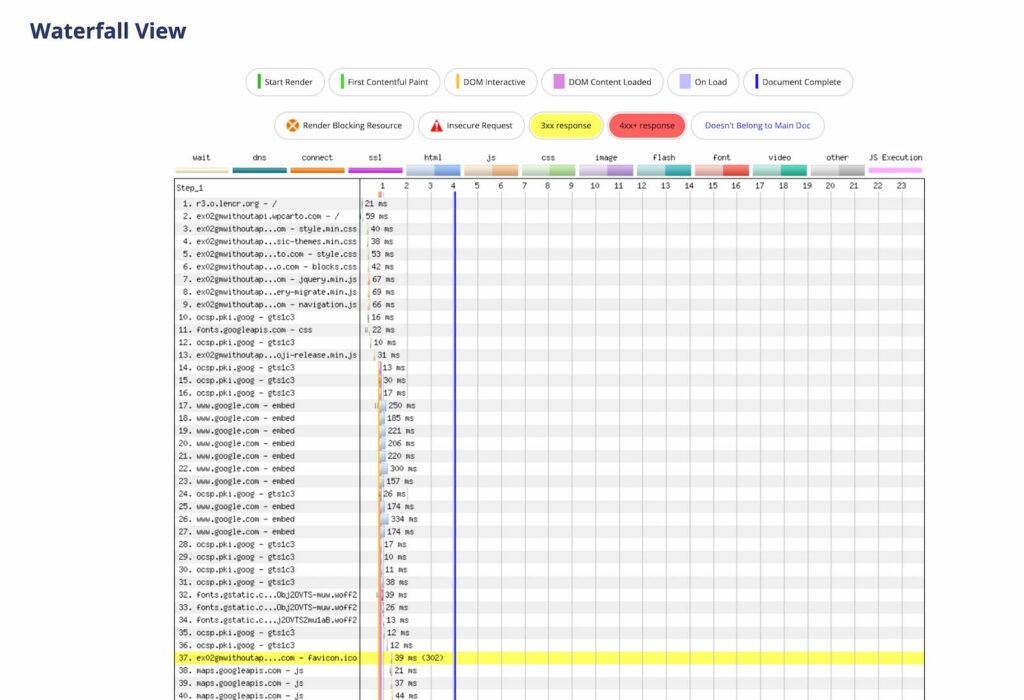
As you can see, this graph shows all the requests made by a website from the moment we enter the domain name, or click from a search result on Google, until the page is fully loaded.
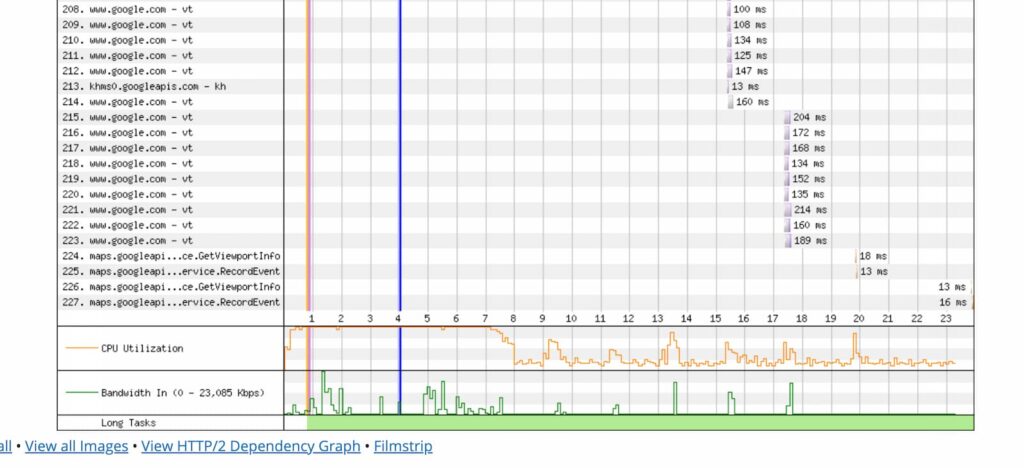
If you look closely at it, from request 17 to the last one, which is 227, the word Google appears. As a result, more than 200 requests are being made to Google over the course of 23 seconds of loading. It’s true that you can interact with the web before those 23 seconds are up, but I would have already left.

## Let’s get rid of doubts with an experiment
From seeing this, I decided to do an experiment. To do this, I created 6 identical WordPress websites. These websites had the same features:
- A Classic Track (Twenty Twelve)
- 10 entries that were displayed in full on the homepage. Yes, there are websites that may need to display multiple maps on the same page, and that’s why I wanted to see the cumulative effect they could have on the performance of the page.
- To all the websites, except for one that I used as a control, I inserted 10 maps, one in each entry, with different locations so that they would not be cached.
- I did 5 speed tests on each of the websites with WebPageTest in order to obtain a representative sample and an average measure. I calculated this average with the median and not with the mean, in order to eliminate the bias effect of some anomalous measures.
From the tests I extracted the following parameters, which I considered the most important to answer my questions:
- FCP (First Contentful Paint): This is the time it takes until the first pixel is painted on the screen since the web was called.
- DC Time (Document Complete Time): This is the time that elapses until everything that is necessary for us to interact with the elements of the web while things continue to load is loaded.
- Time: This is the total loading time of the website. When the navigator’s wheel stops, indicating that there is no more to load.
- Requests: These are all the external requests that are made from the website in order to display all the content.
- Total bytes: This is the weight of the files downloaded in our browser to display the entire website in kbytes.
I put all this together in a spreadsheet, calculated the averages for each of the chosen parameters (please don’t go, these are the only numbers you’re going to see).

Results of the experiment
If we look at the results obtained for the first two parameters, First Contentful Paint and DC Time, we see that there are no significant differences.
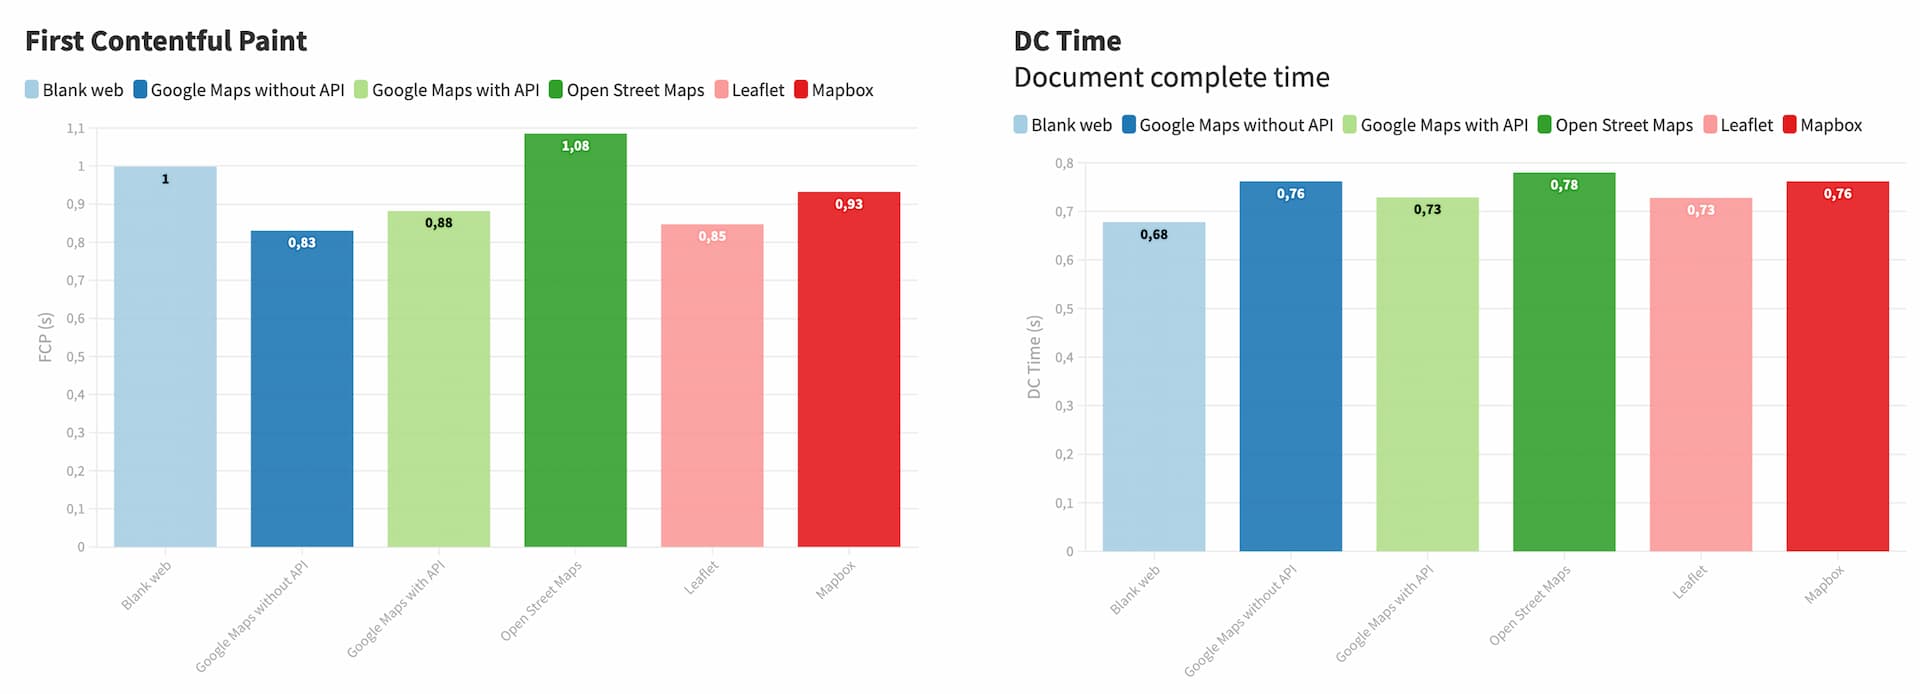
It should always be borne in mind that, in these and the following graphs, the first column corresponds to the control website, the second to the website where I added the Google maps with an iFrame (without API), the third is a website in which Google Maps maps are added with a plugin and making use of the API. Of the following, the fourth corresponds to the use of a plugin that inserts the maps using Open Street Map, the fifth is a plugin that works with Leaflet and the last is the plugin that makes use of Mapbox. These are therefore the plugins that I mentioned at the beginning of the article.
If you notice, the first pixel is painted with differences of tenths of a second, while the moment at which we can interact is basically the same with very little difference. A Photo-Finish would have to be done.
Therefore, this tells us absolutely nothing. But what about the other parameters? Let’s see the result.
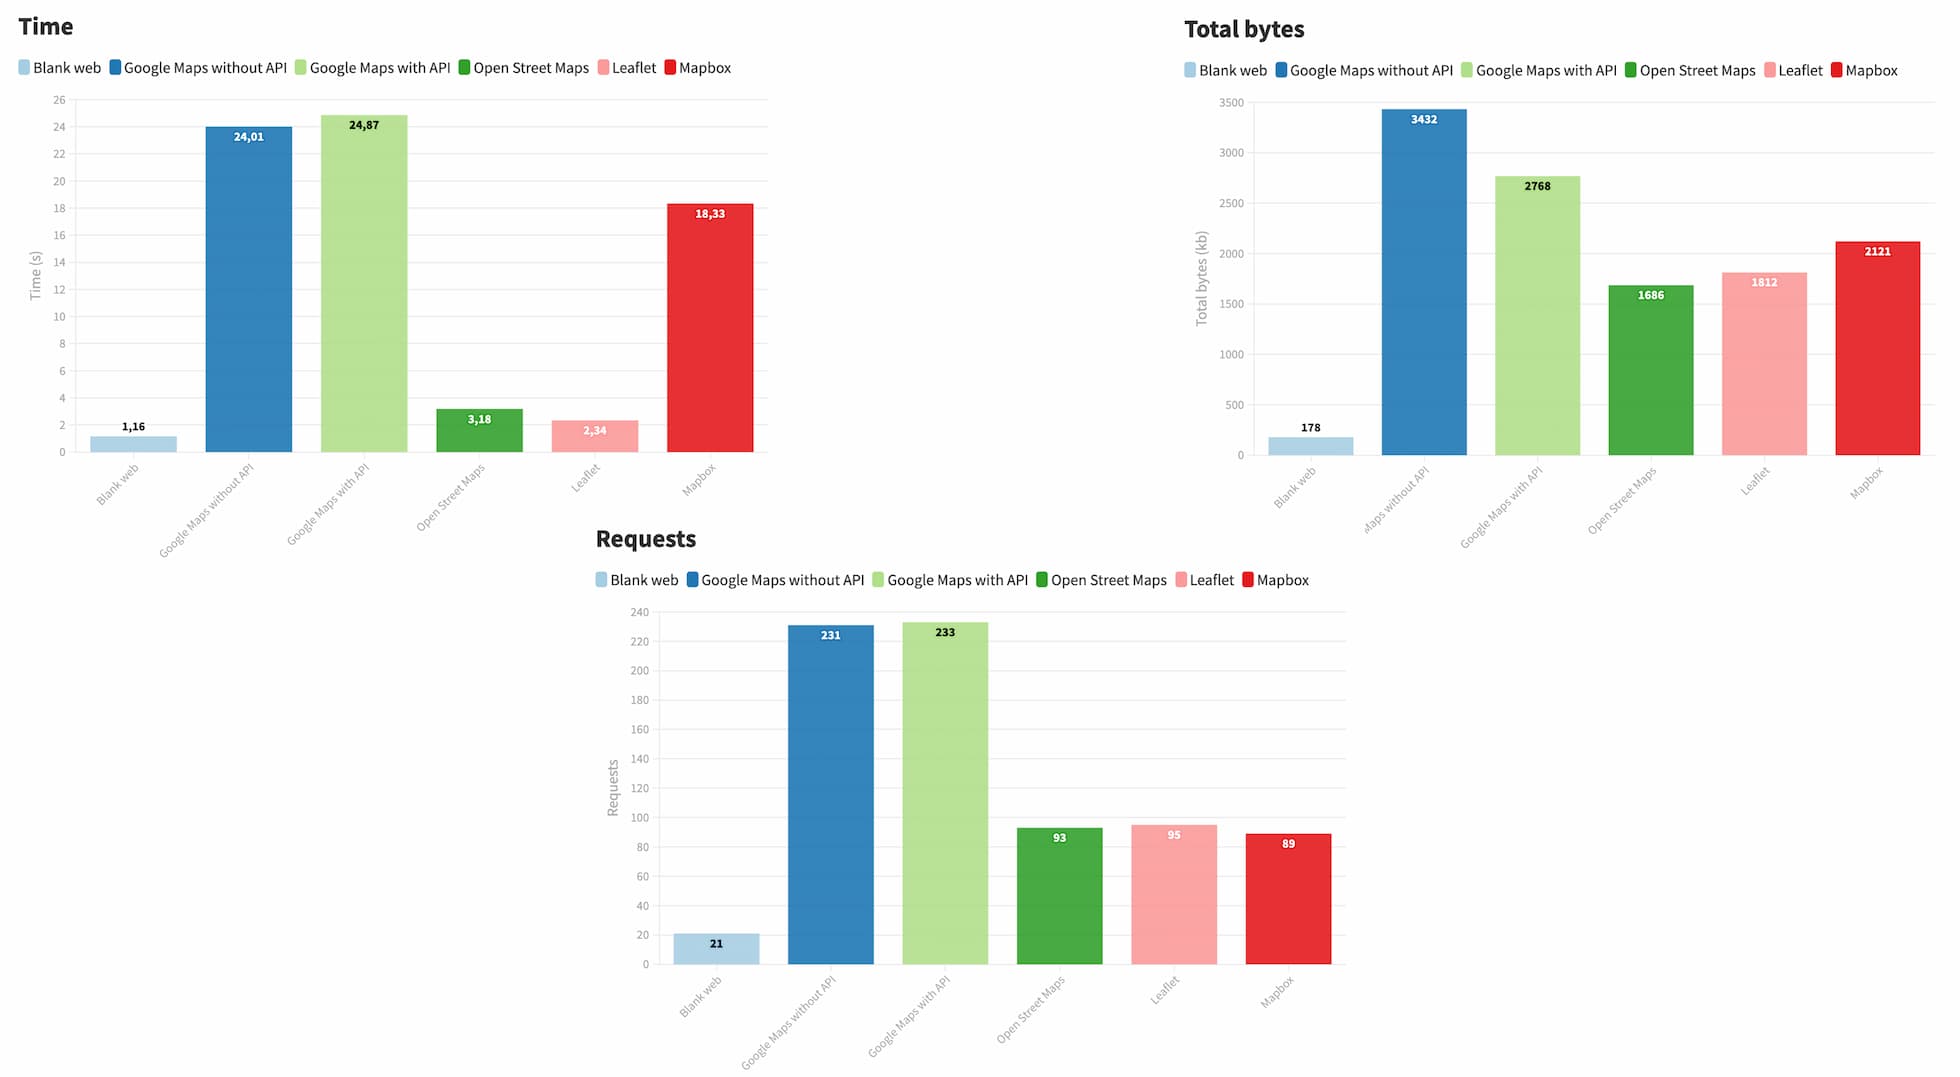
Well, you can tell now, the twin towers in all the graphs correspond to Google.
As you can see, the control website has done its job, and gives the significantly lower values in the total loading time of the website, in the amount of data downloaded and in the number of requests, which are minimal.
However, we see that both the total load time and the number of requests are really outrageous both in the case of inserting a map with an iFrame and in the case of doing it through a plugin and connecting with the Google API.
It is worth noting the short time it takes to load both Open Street Map and Leaflet, as well as the low number of requests made by the three different options to Google.
Without a doubt, the worst option is the insertion of an iFrame. Embedding a website within another is a bit old-fashioned, it’s a technology of the past.
Mapbox does take a longer total load time, which is close to Google, and it’s understandable, since it offers graphical possibilities that are not those of Google. In fact, we’re going to treat Mapbox a bit separately, since it’s a Javascript library, with a 3D rendering engine, that allows us to do amazing things.
What solution would you choose to insert a map?
I think that in light of the results of these experiments, there is no doubt that Leaflet, due to the possibilities it offers and its performance, seems to be the most suitable option when it comes to inserting a map on a website.
In fact, if you are a WordPress developer, I invite you to get into Leaflet, and to create new plugins that use this library. If you don’t know what Leaflet is, I invite you to get to know it in this article.
How can we embed Leaflet in WordPress?
We can do it thank you. Various plugins:
- Map Block Leaflet: It’s a fantastic plugin, and very simple, that I told you about in this blog. Adding simple maps is great.
- Leaflet Map: You could say it’s the official Leaflet plugin. It’s quite complete, although it drags a bit of the delay of still working with shortcodes. However, it’s a very good option for slightly more complex maps.
- Extensions for Leaflet Map: This is a complement to the previous plugin, and it allows us to do crazy things. It’s somewhat experimental, but you can’t miss it if you want to make more vitaminized maps. For example, with it we could assemble maps of bike routes from the .gpx file of our GPS. But there is much more that can be done.
Conclusions
As we have seen in this article, free software offers us very powerful options to introduce maps on a WordPress website, without compromising its performance.
According to the data, Google Maps offers rather little and at a fairly high cost of performance and privacy.
Therefore, a very interesting option can be Leaflet, in case we have basic to intermediate usage needs. And, if we need to offer more power, with 3D maps, showing certain effects, etc., Mapbox will always be a very good option.
Tell me in the comments about your experience, and if you know of other plugins for embedding maps, that use free software.